Description
This TECHCET Executive Edition provides information on the dependencies of the Semiconductor industry on the Germanium and Gallium Supply Chains, especially as they relate to the US. Information is provided on the sources of these key materials, in what form they are used for semiconductor production, the importance of their use, and China vs. US mining and mineral production capacity. An assessment of the overall supply risk to the Western world is also provided.
Featured Press Release on Ge/Ga Supply Chain Report Highlights:
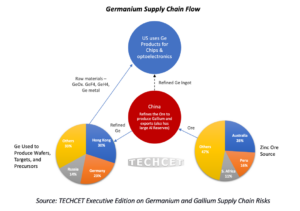
TABLE OF CONTENTS
Click here for a PDF download of the full table of contents
1	SCOPE	6

2	EXECUTIVE SUMMARY	6

3	GERMANIUM	8
3.1	GERMANIUM OVERVIEW – WHY IS IT IMPORTANT?			8
3.2	GERMANIUM - WHAT KINDS OF SEMICONDUCTOR IS IT USED FOR?		8
3.3	GERMANIUM - WHERE DOES IT COME FROM?				9
3.4	HOW IS IT MADE? FROM ORE TO END USE PRODUCT			10
3.4.1	Leading North American Sources of Germanium:			10
3.4.2	How is GeH4 made?						11
3.5	SUPPLIERS OF GE END USE PRODUCTS TO THE SEMICONDUCTOR INDUSTRY	13
3.5.1	US GeH4 Producers						13
3.5.2	Germanium Sputter Targets and Substrates			14
3.5.3	Tracing the GeH4 Supply Chain					14
3.6	GERMANIUM US IMPORTS - ORIGINATING LOCATION AND MIX		16
3.7	GERMANIUM - BUILDING NEW US CAPACITY				17
3.8	GERMANIUM – WHO USES IT?  SEMICONDUCTOR DEVICE MANUFACTURERS	17
3.9	GERMANIUM RAW MATERIAL PRICE TRENDS				18

4	GALLIUM		20
4.1	GALLIUM OVERVIEW – WHY IS IT IMPORTANT?				20
4.2	GALLIUM – WHAT KIND OF ELECTRONIC DEVICES IS IT USED FOR?	20
4.3	GALLIUM WHERE DOES GALLIUM COME FROM?				21
4.4	HOW IS IT MADE? FROM ORE TO END USE PRODUCT			22
4.5	SUPPLIERS OF GA END USE PRODUCTS TO THE SEMICONDUCTOR INDUSTRY	24
4.5.1	Tracking the Gallium Supply Chain				25
4.6	GALLIUM US IMPORTS - ORIGINATING LOCATION AND MIX		27
4.7	GALLIUM - BUILDING NEW US CAPACITY				28
4.8	GALLIUM – WHO USES IT? SEMICONDUCTOR DEVICE MANUFACTURERS	28
4.9	GALLIUM RAW MATERIAL PRICE TRENDS				29

5	CHINA GA & GE TRADE RESTRICTIONS	31

6	GALLIUM AND GERMANIUM GEOPOLITICAL RISKS & ASSESSMENT	32

7	REFERENCES	34

FIGURES
FIGURE 1: GERMANIUM AND GALLIUM PRODUCTION BY REGION ESTIMATES		7
FIGURE 2: US GERMANIUM USE APPLICATIONS ESTIMATE (AS A PERCENT OF
TOTAL WEIGHT) 2022							8
FIGURE 3: SILICON-GERMANIUM (SIGE) IS CRUCIAL IN 2
NM GAA-FET FABRICATION							9
FIGURE 4: 2021 GERMANIUM PRODUCTION ESTIMATES AS A PERCENTAGE OF
TOTAL OUTPUT (TONS)							10
FIGURE 5: GEO2 AND GECL4 PRODUCTION FROM GE CONCENTRATE			12
FIGURE 6: AIR LIQUIDE (VOLTAIX) GERMANE PLANT IN BRANCHBURG, NJ (USA)	14
FIGURE 7: GERMANIUM ORE TO FINISHED PRODUCTS INTO THE US –
SUPPLY CHAIN FLOW							15
FIGURE 8: GERMANIUM US IMPORTS BY COUNTRY OF ORIGIN			17
FIGURE 9: SEMICONDUCTOR DEVICE MANUFACTURERS USING SIGE TECHNOLOGY
BY REGION (AS A PERCENT OF 200MM EQUIVALENT CAPACITY*)			18
FIGURE 10: GERMANIUM PRICE TRENDS 2018 TO 2023				19
FIGURE 11: GERMANIUM METAL SHANGHAI METAL MARKET FUTURES
(PRICES PER KG)								19
FIGURE 12: CHINA WROUGHT AND UNWROUGHT GERMANIUM EXPORT FOR
JAN – AUG 2023								20
FIGURE 13: WORLD GALLIUM PRODUCTION AS A PERCENT OF TOTAL VOLUME
(METRIC TONS)								22
FIGURE 14: GALLIUM PRECURSOR SUPPLY CHAIN				23
FIGURE 15: EXAMPLE OF MOLECULAR BEAM EPITAXY SYSTEM			24
FIGURE 16: GALLIUM ORE TO FINISHED PRODUCTS INTO THE US –
SUPPLY CHAIN FLOW							26
FIGURE 17: US GALLIUM IMPORTS SHOWING COUNTRY DEPENDENCY		28
FIGURE 18: : SEMICONDUCTOR DEVICE & LED MANUFACTURERS USING
GAAS/GAN/GAP BY REGION							29
FIGURE 19: GALLIUM METAL PRICE TRENDS 2018-2023				30
FIGURE 20: GALLIUM METAL SHANGHAI METAL MARKET FUTURES (PRICES PER KG)	30
FIGURE 21: CHINA WROUGHT AND UNWROUGHT GA EXPORTS 2023			31

TABLES
TABLE 1: ELECTRONIC DEVICES AND THEIR USE OF GERMANIUM			9
TABLE 2: GERMANIUM SEMICONDUCTOR VALUE CHAIN				16
TABLE 3: MOST POPULAR APPLICATIONS FOR GALLIUM SUBSTRATES INCLUDE
GAAS AND GAN COMPOUND							21
TABLE 4: GA-CONTAINING SEMICONDUCTOR PROCESS MATERIALS SUPPLIERS
AND LOCATIONS								25
TABLE 5: GALLIUM SEMICONDUCTOR VALUE CHAIN				27