Description
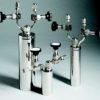
This report is focused on technical ceramic materials market and supply-chain which includes SiC/ CVD SiC, AlN, Al2O3, Y2O3, and BN used in the production of components and assemblies for use in semiconductor process equipment. SiC is frequently used for both carriers (boats, gas injectors, and fabware) and components for OEMs where high temperature or specific thermal packages are required, while traditional Al2O3 and AlN ceramics are normally used for lower temperature / etch applications. The machines/tools manufacturers that use these components are referred to as OEMs (Original Equipment Manufacturers). This report targets ceramics used in the manufacture of semiconductors, only.
Featured Press Release on Ceramics Market Updates and Report Highlights:
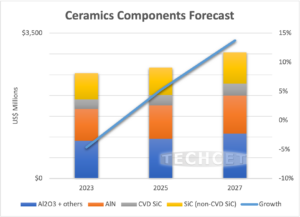
Table of Contents:
Click here to view the full Table of Contents
1 Executive Summary 8
1.1 Highlight Material Segment Business Overview 8
1.2 Alumina 10
1.3 Aluminum Nitride (AlN) & SiC 10
1.4 CVD SiC 11
1.5 Al2O3 / HPA 12
1.6 Other Materials 12
1.7 M & A 12
1.8 General Comments 12
2 Scope, Purpose and Methodology 13
2.1 Scope 13
2.2 Purpose 13
2.3 Methodology 13
2.4 Overview of Other TECHCET CMR™ Reports 14
3 Market Outlook 15
3.1 Semiconductor Industry Market Status & Outlook 15
3.2 Global Economy 15
3.2.1 Semiconductor Industries Ties to the Global Economy 17
3.2.2 Semiconductor Sales Growth 18
3.2.3 Taiwan Monthly Sales Trends 19
3.3 Electronic Goods Market 20
3.3.1 Electronic Goods Market 20
3.3.2 Automotive Sales 22
3.3.3 Servers / IT 24
3.4 Semiconductor Fabrication Growth & Expansion 24
3.4.1 Fab Expansion Announcement Summary 24
3.4.2 Worldwide Fab Expansion Driving Growth 26
3.4.3 Equipment Spending Trends 27
3.4.4 Technology Roadmaps 28
3.4.5 Policy and Trade Issues 28
3.5 Semiconductor Materials Outlook 29
3.5.1 Could Materials Capacity Limit Chip
Production Schedules 29
3.5.2 Continued Logistics Issues Plague the Western World 30
3.5.3 Wafer Start Growth 30
3.5.4 Materials Forecast 31
4 Material Market Drivers & Dynamics 33
4.1 Ceramic Material Applications and Suppliers 33
4.1.1 Thermal Processes 35
4.1.2 Dry Etching Process 36
4.1.3 Deposition: Plasma CVD and PVD 36
4.1.4 Epitaxial Process 36
4.2 Material Shortages and Supply Chain Constraints 37
4.3 Materials Trends 38
4.4 Technical Drivers / Material Changes and Transitions 39
4.4.1 Material Trends for the Leading-Edge 40
4.4.2 Trends/Impact/Status of Legacy Materials
(200 mm & 150 mm) 40
4.5 Comment on Regional Trends/Drivers 41
4.6 EHS, Logistic, AND Exogenous (Weather) Market Issues 42
5 Supplier Market Landscape 44
5.1 Ceramics Overall Market Size and Forecast 44
5.1.1 Ceramic Components Fabricators: 45
5.2 Ceramic Suppliers Total Market Share Roll-up 49
5.3 Ceramic Component Market Summary 50
5.3.1 2022 to 2023 Market Dynamics – OEMS and Chip Fabs 52
5.4 M&A Activity 53
5.5 Expansions or New Plants of Existing Suppliers 53
5.6 Suppliers or Parts/Product Line that Are at Risk
of Discontinuation 55
5.7 Pricing Trends 55
5.8 Aluminum Nitride (AlN) Market Segment 55
5.8.1 AlN Competitive Market Shares & Activity 57
5.9 Alumina (Al2O3) and Other Oxides (BN, YtO, ZrO)
Components 58
5.9.1 Al2O3 Opportunities and Impact of Automotive
Applications 60
5.10 Silicon Carbide / CVD SiC Market Segment 62
5.10.1 CVD SiC 64
5.10.2 Alternatives to SiC Component Technology 67
5.11 Ceramics Market Regional Activity 68
5.12 Ceramic Fabrication by Process Segment 70
6 Sub tier material supply chain 71
6.1 Sub-Tier, Ceramic Blank Manufacturers 71
6.2 Aluminia (Al2O3) Production Process 72
6.2.1 Vertically Integrated Alumina Producers 75
6.3 Silicon Carbide – SiC Sub-tier Players & Price Points 75
6.4 Yttria Powder Production Players & Price Points 76
6.5 M&A of Raw Materials Companies 77
6.6 New Plants or Expansions 77
6.7 Plant Closures & Products at risk of discontinuation 77
7 Supplier profiles (Fabricators) 78
8 Appendices 79
TABLE OF FIGURES
Figure 1: Total Ceramics Market Forecast and Growth Estimates
(2022-2027) 8
Figure 2: Global Economy and the Electronics Supply Chain 17
Figure 3: Worldwide Semiconductor Sales 18
Figure 4: Monthly Sales Trends of Taiwan Outsource
Manufacturers 19
Figure 5: 2022 Semiconductor Chip Applications 20
Figure 6: Mobile Phone Shipments WW Estimates 21
Figure 7: Worldwide PC and Tablet Forecast, 2021, Q3 22
Figure 8: Electrification Trend by World Region 23
Figure 9: Semiconductor Spend per Vehicle Type 23
Figure 10: Chip Expansions 2022-2027, about US$336 B 25
Figure 11: US Chip Fab Expansions 26
Figure 12: Overview of Logic Device Technology Roadmaps 28
Figure 13: Europe Chip Expansion Upside 30
Figure 14: 200mm Wafer Equiv Starts/year 31
Figure 15: Global Semiconductor Materials Outlook 32
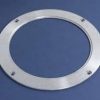
Figure 16: Ceramic Products for Semiconductor Applications 34
Figure 17: Fabricated Ceramics Components for Thermal Process 35
Figure 18: Fabricated Ceramics Components for Dry
Etching Process 36
Figure 19: Total Ceramics Market Forecast and Growth Estimates
(2020-2027) 45
Figure 20: 2022 Market Shares for All Ceramics
(incl. SiC/CVD SiC) 49
Figure 21: WW Ceramics Components Forecast 51
Figure 22: Aluminum Nitride (AlN) Components Forecast and
Growth Estimate 56
Figure 23: AlN Parts Fabricator Market Share Estimates
(as a % of total revenues) 58
Figure 24: Alumina (+ other oxides) Component Revenue
Forecast Estimate 59
Figure 25: Alumina + BN, Yt2O3, ZrO2 Parts Fabricator
Market Share Estimate (as a % of total revenues) 60
Figure 26: 99.8% and HPA (99.99) Alumina Components Forecast
(metric tons) 61
Figure 27: SiC Components Market Revenues ($M's USD) 63
Figure 28: SiC (+ CVD SiC) Components Market Shares
(as a % of total revenues) 64
Figure 29: CVD SiC Components Market Forecast 65
Figure 30: CVD SiC Components by Share of Application
(as % of total revenues) 66
Figure 31: CVD SiC Components Relative Pricing 67
Figure 32: 2022 Regional Sales / Shares of Equipment
Components (% of end-use location) 68
Figure 33: 2023 Regional Performance Comparison of
Fabricators by Country (1=2022 Revenue) 69
Figure 34: 2022 Equipment and Ceramic Parts Demand by
Technology Nodes 70
Figure 35: Global Bauxite Mining Locations
(as a % of total metric tons) 73
Figure 36: Alumina Production by Region
(as a % of total metric tons) 74
Figure 37: Specialty Alumina Powder by Supplier
(Raw Material as a % of total metric tons) 74
LIST OF TABLES
Table 1: Ceramic Segment Revenues and CAGRs 10
Table 2: TECHCET Critical Material Reports 14
Table 3: Global GDP and Semiconductor Revenues 15
Table 4: Table 3: IMF World Economic Outlook 16
Table 5: Total Fabricated Ceramic Components Revenue History
and Forecast* 45
Table 6: Ceramic Fabricators (including SiC) Offerings 47
Table 7: 2022 TECHCET WW Ceramics Components 5-year Forecast 51
Table 8: Total SIC Components Market Revenues Forecast and
CVD SiC Split ($M’s USD) 63
Table 9: Production Ranking of Ceramic Blank Manufacturers 72
Table 10: Product Offerings and Purity of Leading Alumina
Powder Producers 75
Table 11: High Purity Silicon Carbide Powder Producers Ranking 75
Table 12: High Purity Alumina Nitride Powder Producers Ranking 82